Want Coffee with your Workload Simulation?

Coffee is an OLTP (online transaction processing) workload simulator for SQL Server, Azure SQL Database, and Azure SQL Managed Instance, which mimics the activity of a point-of-sale (POS) system. It simulates the handling of hundreds of orders created, updated, and retrieved hourly from dozens of terminals scattered through the restaurant.
The motivation for Coffee came from several projects needing to evaluate database features under load. Throughout those projects I wished I had a modifiable, simple to use, affordable, and scalable tool that would run a set of OLTP workloads against a simple schema, enabling all sorts of fun things:
- Generate test data, useful for testing visualization and reporting tools
- Gauge the performance impact of security features like Always Encrypted or Transparent Data Encryption (TDE)
- Evaluate different network, database, or system configurations
- Perform mock administration tasks (e.g., failing over a replica, modifying a file group) with a live system.
What’s Coffee in a Nutshell?
Servers and kitchen staff place, update, and ring-up orders across several terminals. The simulator mimics this behavior concurrently executing order create, update, and retrieve actions. Action execution is distributed over several threads run in parallel. Each thread deliberately delays triggering an action for a random time interval, which is a random value with-in a set range. The delay avoids all actions executing simultaneously and mimics the ad hoc nature of the workload. The end result is a system that mimics the use pattern of servers and kitchen staff.
What can host a Coffee database?
The project was initially developed with SQL Server 2014 (version-12.x) in mind. However, it has been used with versions of SQL Server through 2019 as well as Azure SQL Databases.
How does Coffee work?
Coffee is written in Windows PowerShell. The project’s repository is hosted in Github. It includes a READ ME that outlines the application’s design, describes usage, and identifies dependencies.
Users interact with the system through a command line interface. Coffee ships with several scripts described in the project’s READ ME. One of the most of these scripts is the launcher script, which initiates workloads. When executed, the launcher idles until the start of the next minute then launches the write, read, and update controllers.
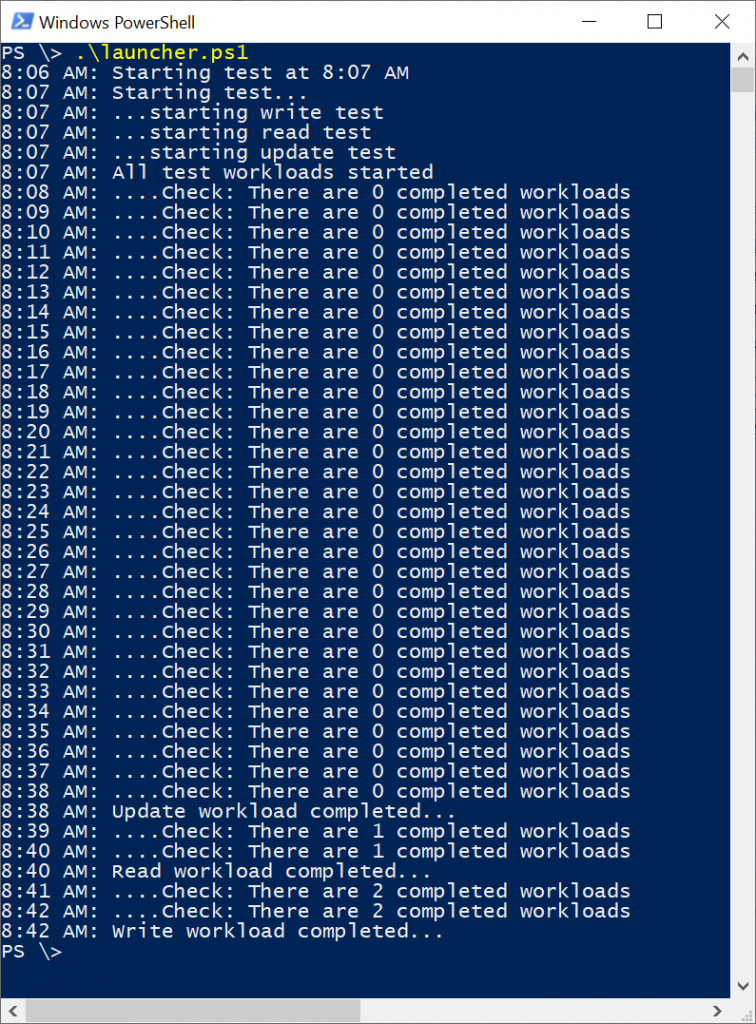
The write, read, and update controllers spawn workload threads that generate load against our database. The whole application runs in a single PowerShell process.
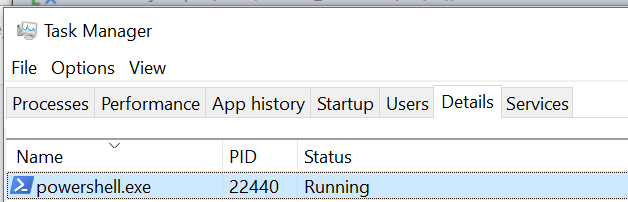
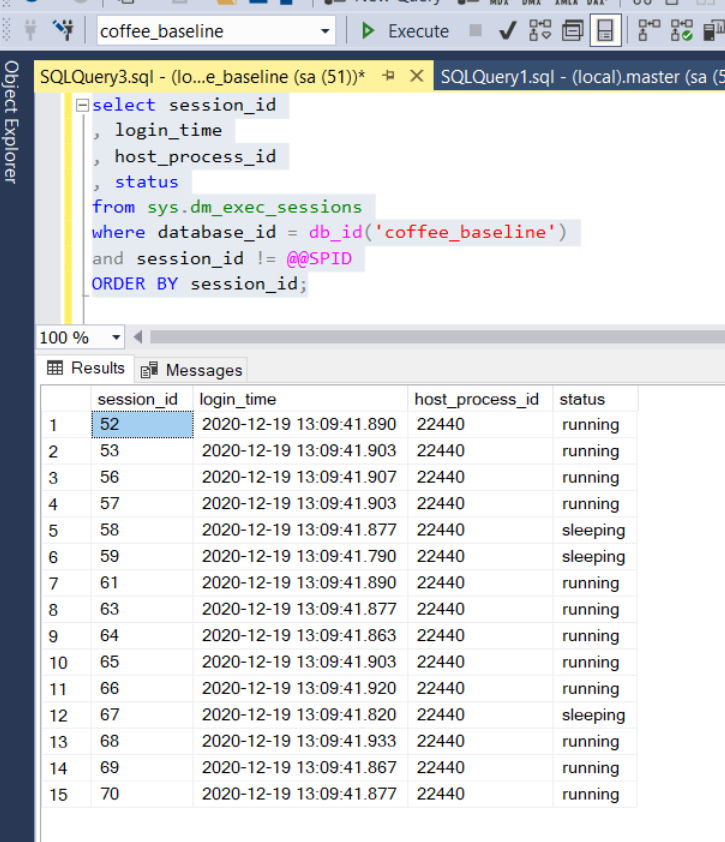
Engineers can adjust the workload volume and concurrency from the launcher script. The volume of work is the number of create, read, and update actions to trigger. The concurrency of work describes how many threads are created for each type of action: read, update, and create. By default, Coffee creates, updates, and reads 35,000, 35,000, and 30,000 orders respectively with each controller spawning 5-threads for a total of 15 threads. Because each thread gets its own connection, you will see 15-sessions for Coffee’s PID when running a simulation with default settings.
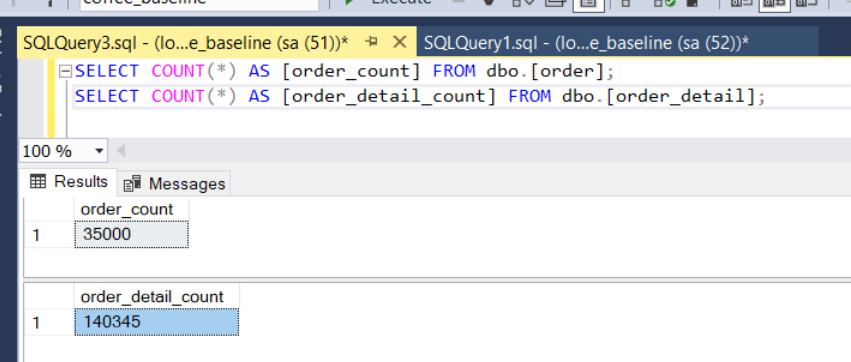
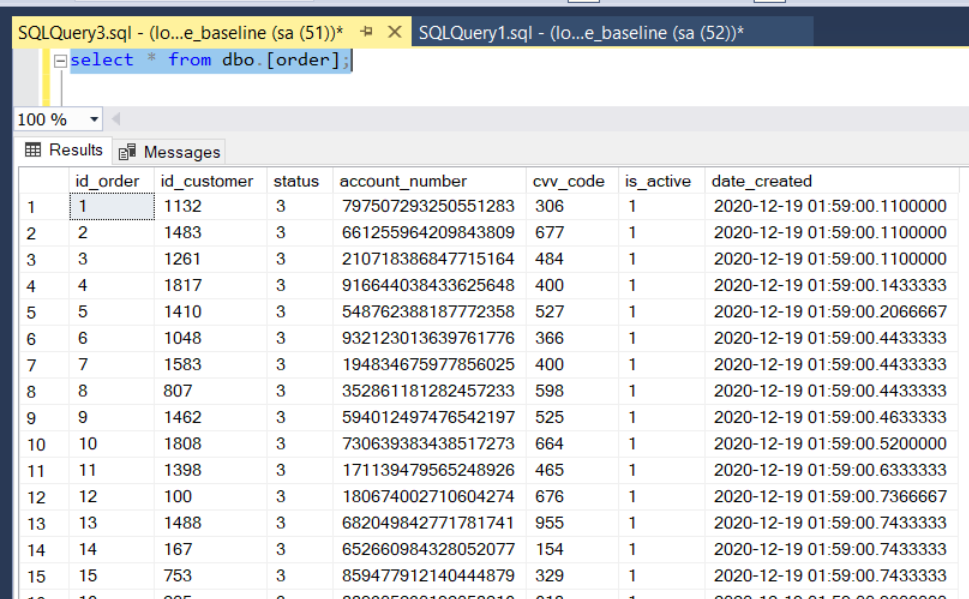
Once the simulation completes, you will be left with the number of orders you asked the write controller to create, 35,000 by default.
I purposely kept the database’s physical model simple and intuitive to make it easy for developers to manipulate and query. The database has four tables all in the “dbo” schema:
- dbo.customer, this table captures the restaurant’s customers.
- dbo.sustenance, contains the restaurant’s menu items.
- dbo.order, this table contains the restaurant’s orders.
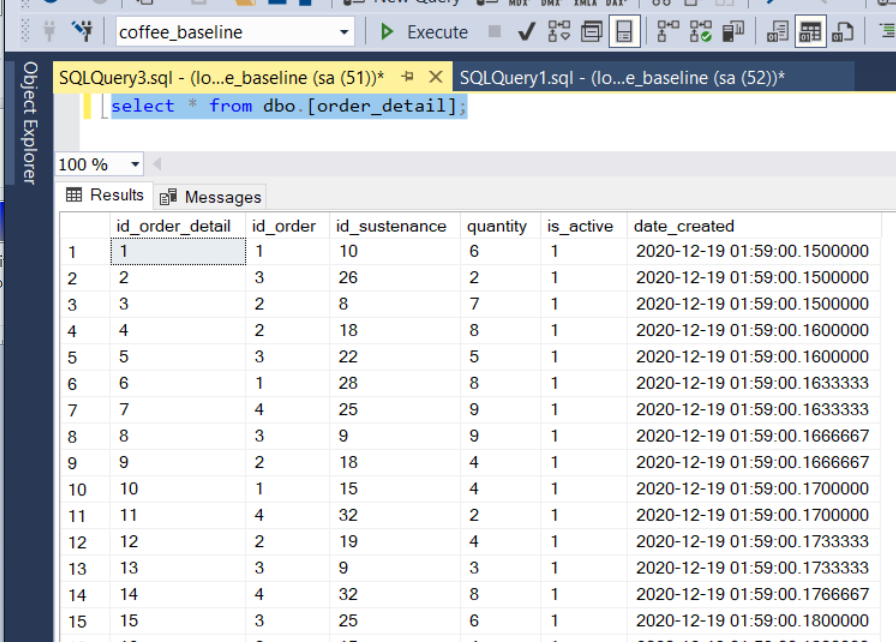
- dbo.order_detail, hosts the dishes purchased with a given order.
The tables are related as follows:
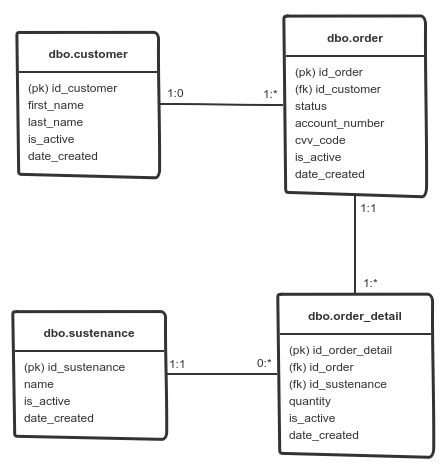
The data generated as part of a simulation remains once the simulation completes.
This data comes in handy when testing visualization and reporting tools, partitioning schemas, or different SQL commands.
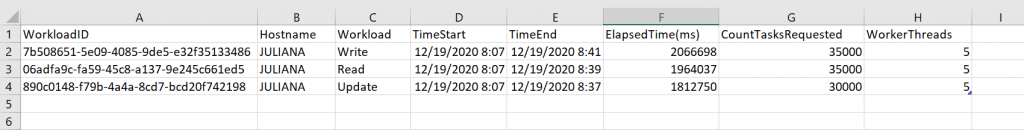
Lastly, Coffee saves runtime metrics for each executed simulation in a pair of files: test summary and test detail. The test summary file captures metrics by workload controller. These metrics include controller start and end date and time, total run time, and number of threads.
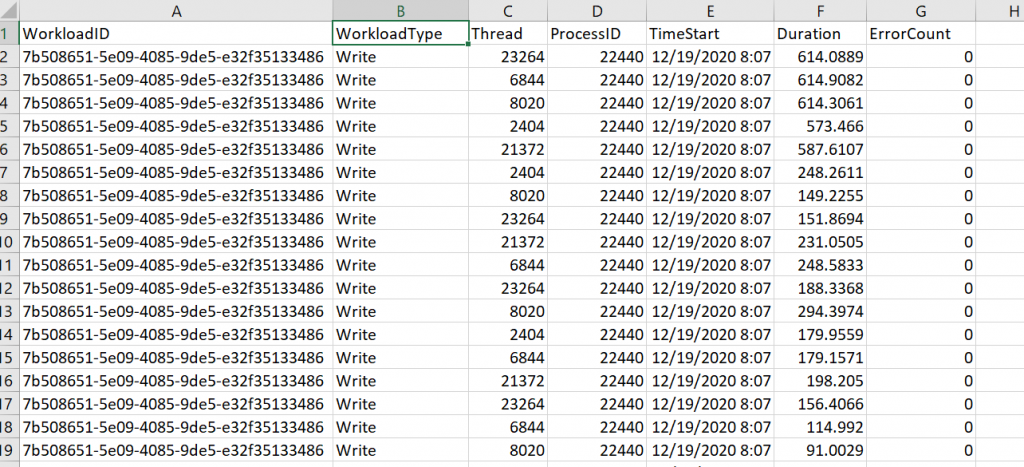
The test detail file captures metrics for each action executed as part of a given simulation. The metrics report include the action’s type, duration, number of errors encountered, worker thread id, and start time.
Each file includes the name of the machine executing the simulation and the simulation’s start date and time. Engineers can use this data in concert with additional metrics to gauge system health.
Conclusions
Engineers can leverage Coffee whenever they need (a) sample data or (b) to gauge system behavior in the context of a condition or system state change.
This project is far from a polished solution. Despite the many areas for improvement, Coffee remains one of my favorite pet projects, and a tool I find myself using again and again in my work. I use Coffee with cloud and on-premise installations of SQL Server. I use it with cloud based DBaaS solutions like Azure SQL Database. I use it in presentations and training classes. I use it to generate test data when exploring data analysis and visualization tools. For these reasons, Coffee is a project I thought worth sharing.